

Ostral
Web Platform — UX/UI, Data Visualization, Prototyping
Ostral
OVERVIEW
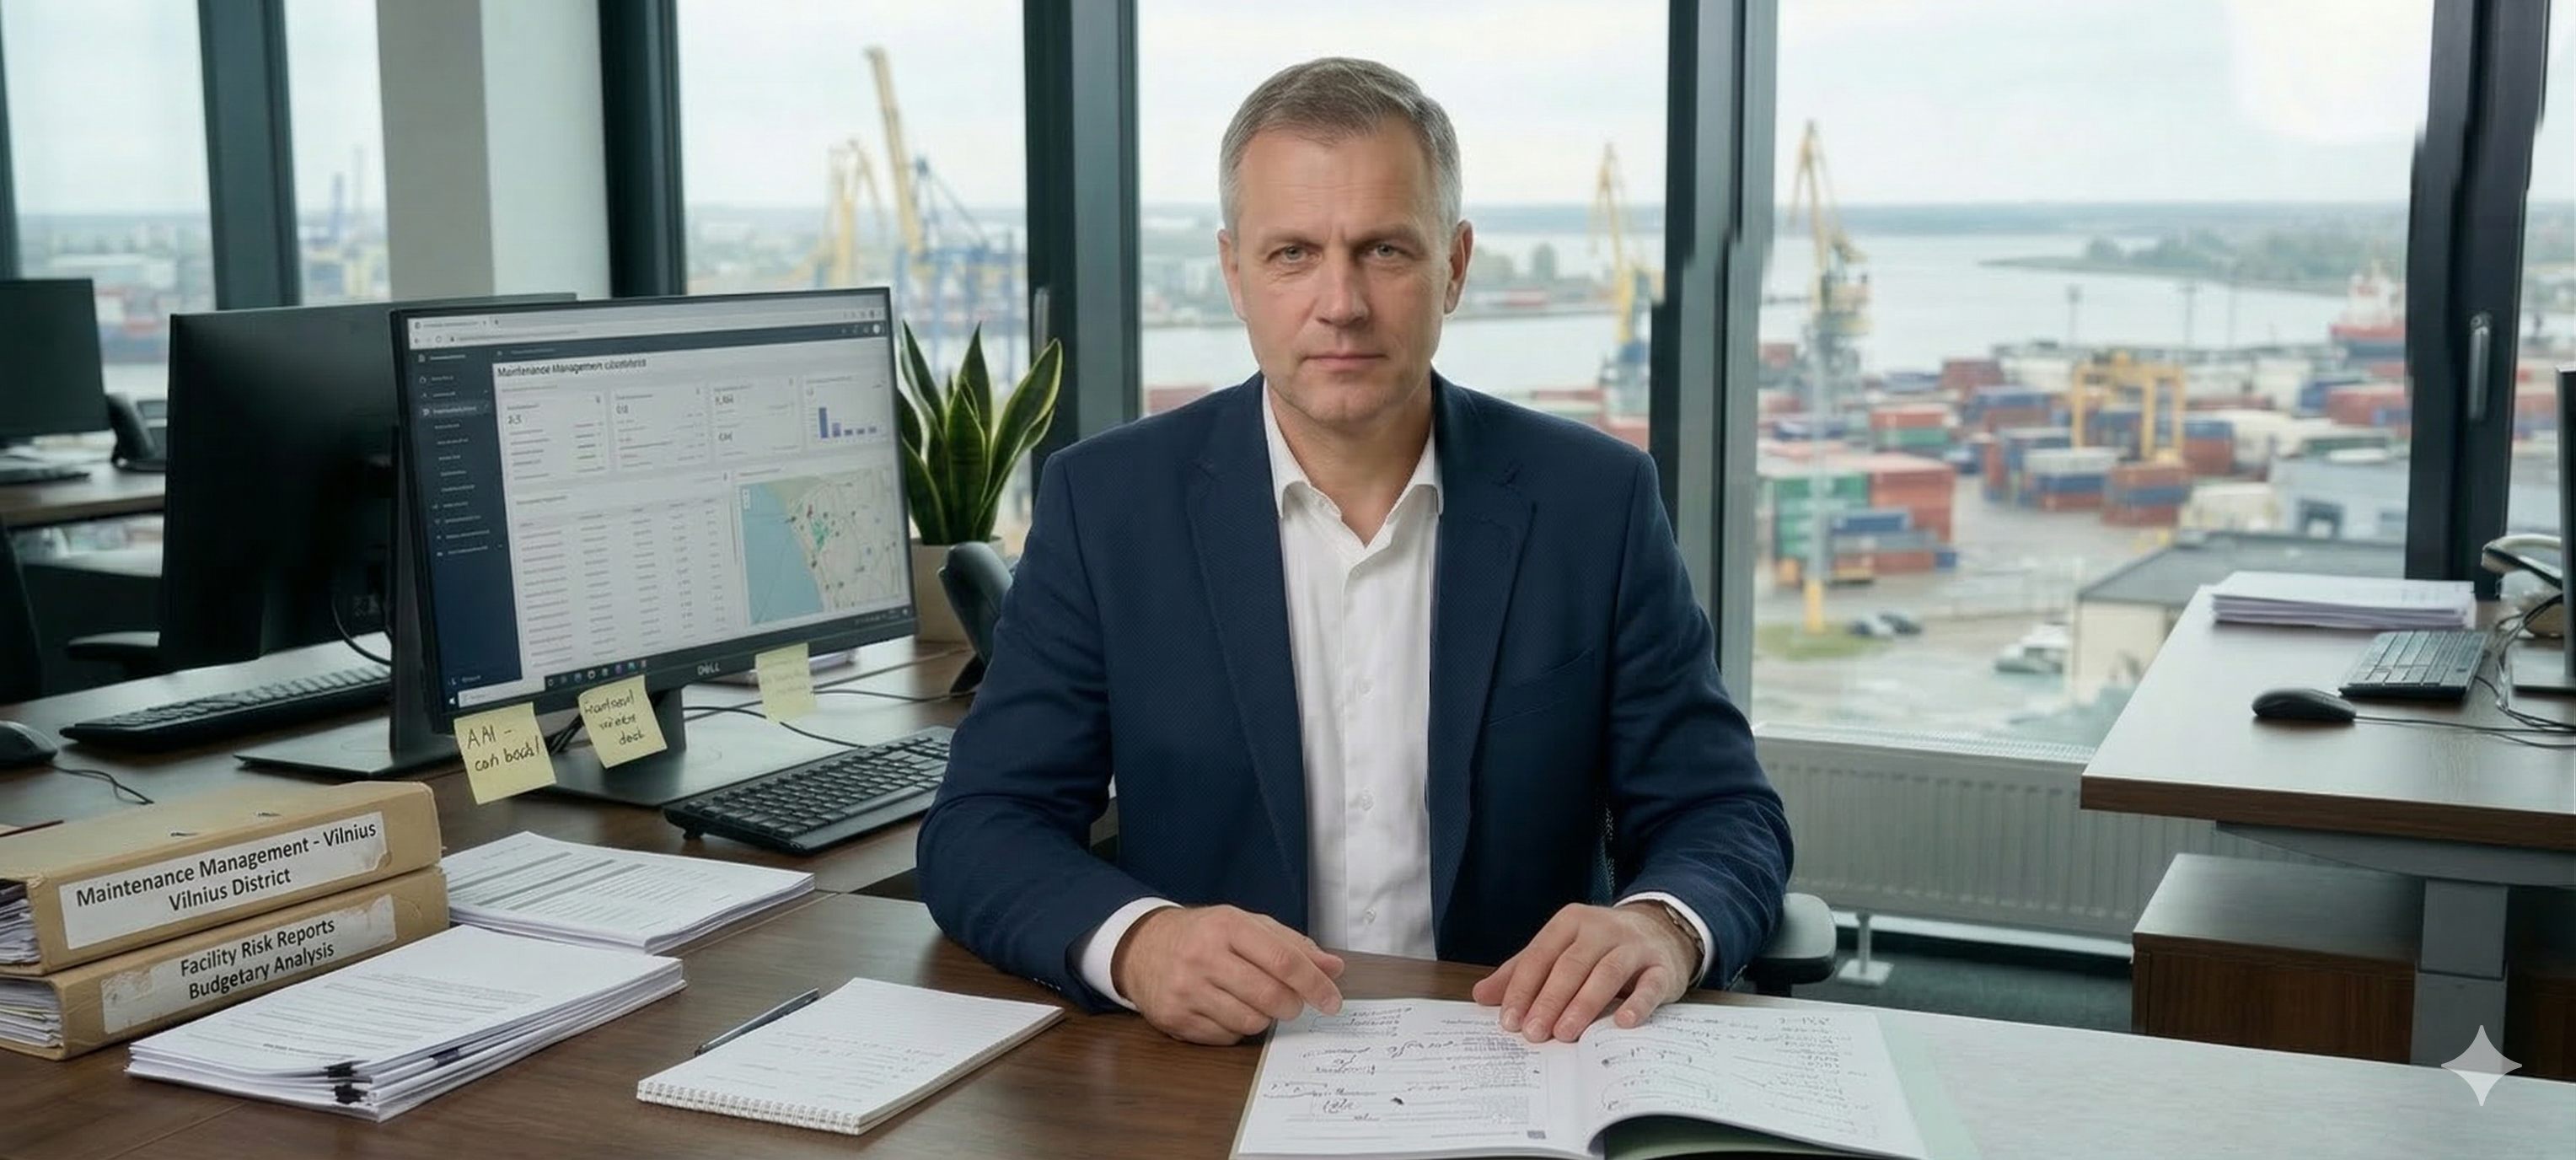
Ostral is a web platform for managing inspection programs and risk monitoring across industrial facilities in the oil refining sector. Built for Hillsec — an engineering company specialising in technical maintenance of petrochemical and fat-processing plants
The core challenge was data density. Thousands of geolocated findings, multi-level risk analytics, complex filterable tables. The design goal was not just to display data — but to help users navigate it fast
ROLE
UX/UI Designer
RESPONSIBILITIES
UX/UI design, data visualisation, prototyping
TEAM
UX/UI designer, project manager
TIMELINE
2 month
Problem Statement
Hillsec's engineering team operated across disconnected tools — findings logged in spreadsheets, site maps in separate systems, reports sent by email. With thousands of geolocated defects and multi-level risk analytics, this made fast decision-making impossible
The goal was to design an advanced MVP — comprehensive enough to demonstrate real product value to the client. The deliverable was a fully interactive prototype covering all key screens and user interactions
Users
The platform serves three distinct roles — from a field engineer to an executive making budget decisions. Understanding their goals and working context shaped the navigation structure and data prioritisation
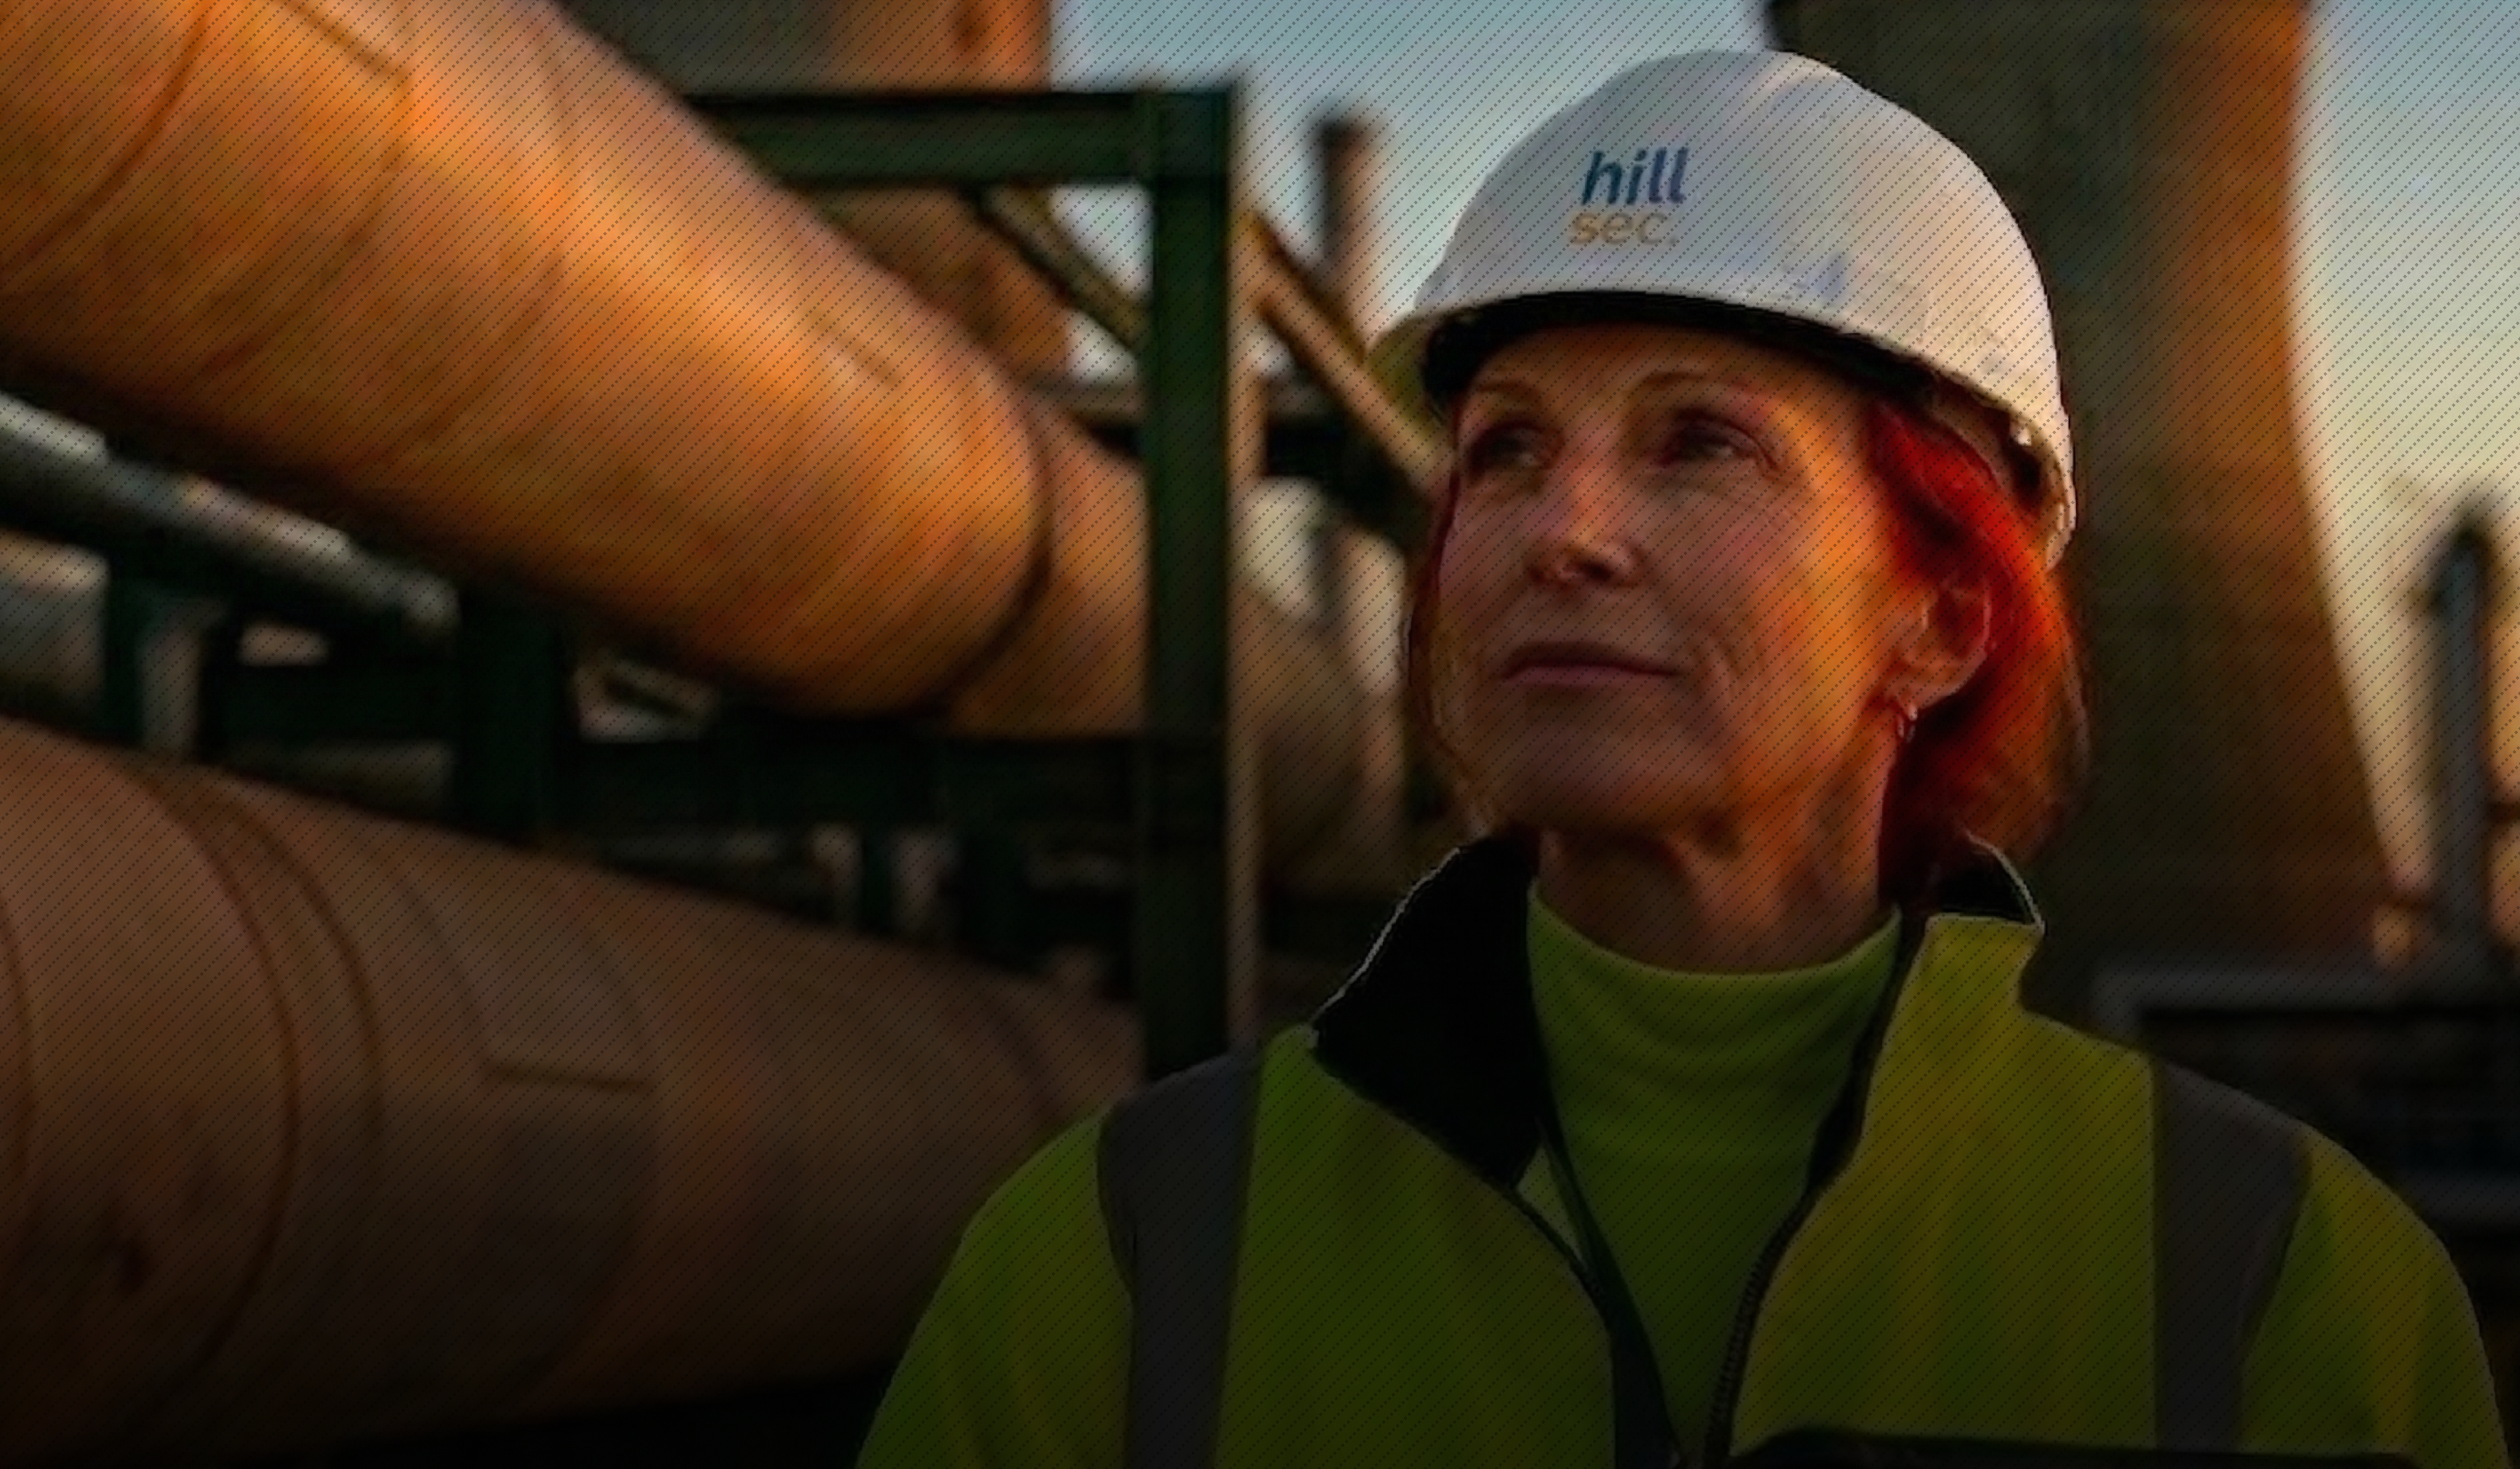
Persona #1
Mark, 42
Senior Inspection Engineer
Spends most of his time on site. Works under high data density — speed of navigation and clear visual hierarchy are critical
Location
Klaipėda
Device
tablet on site, desktop in office
Motivation
quickly locate critical findings and act without switching between tools
Pain
data scattered across systems, no unified view of the facility
Persona #2

Anna, 38
Maintenance Manager
Makes decisions on repair budgets and priorities. Doesn't dig into individual findings — needs the overall picture and risk dynamics
Location
Vilnius
Device
desktop, smartphone on site visits
Motivation
understand facility status and justify repair budgets without calling engineers
Pain
inspection updates only arrive by email, always delayed
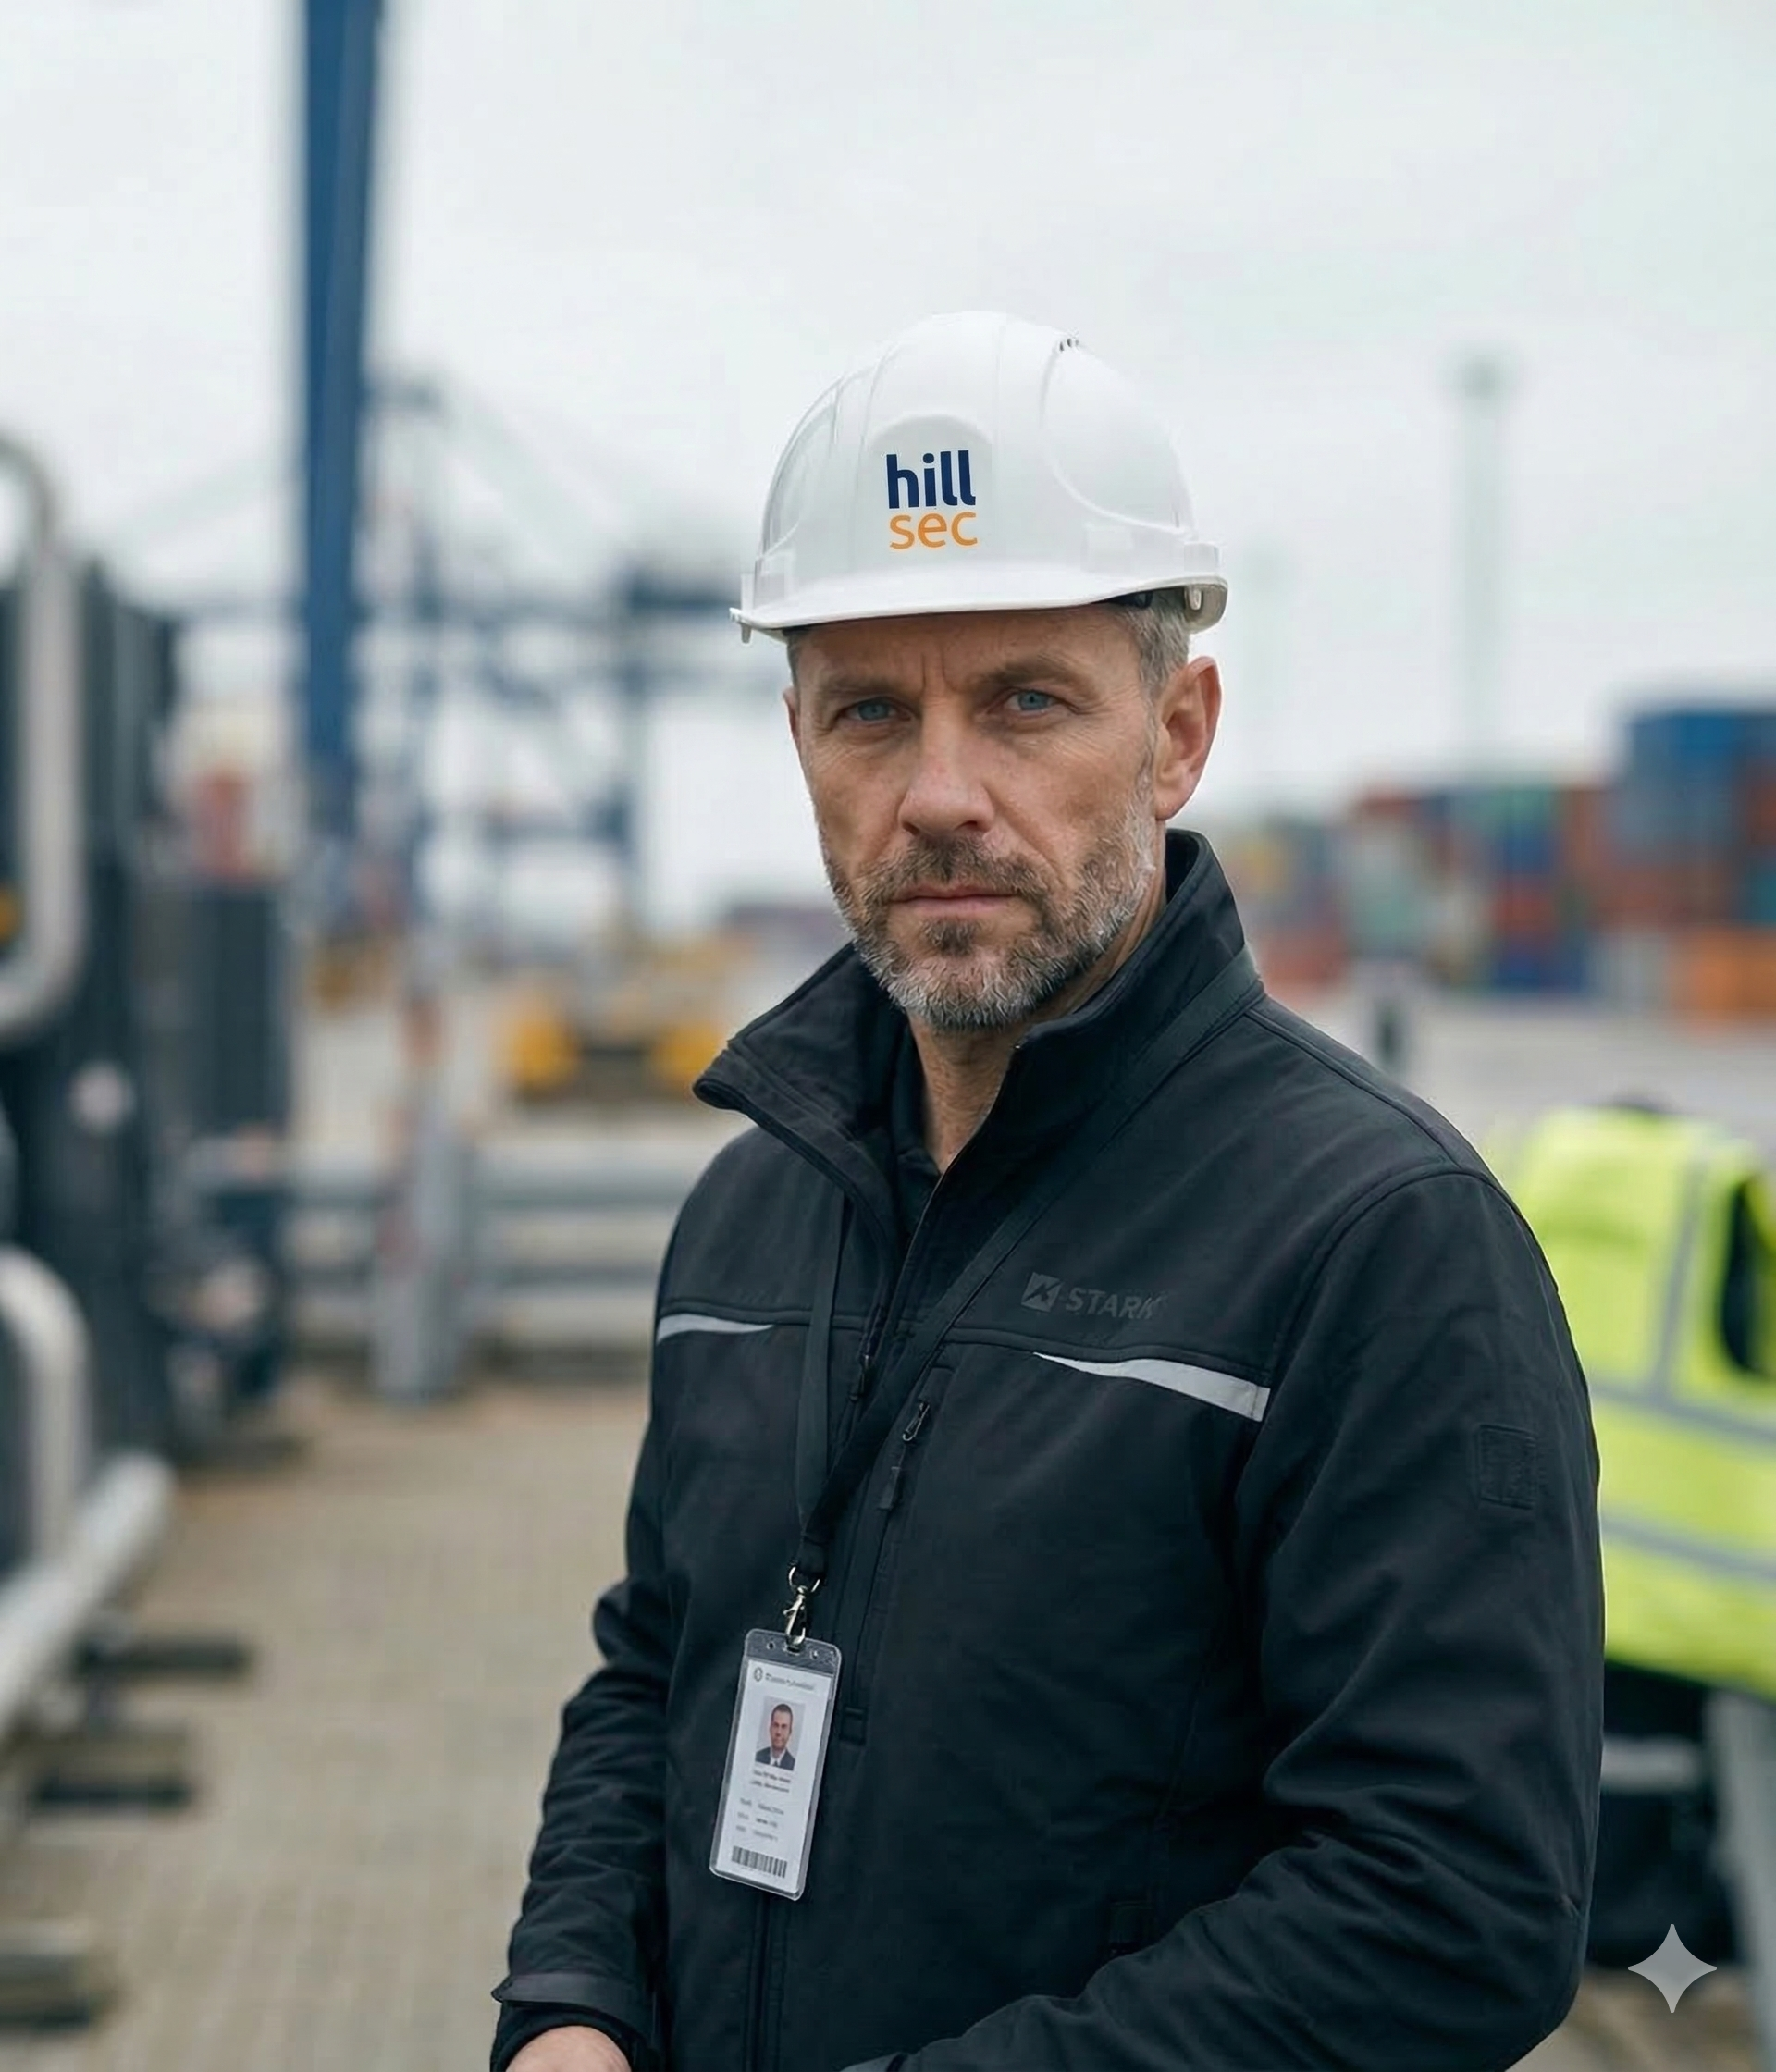
Persona #3
Thomas, 47
Inspection Programs Lead
Coordinates engineering teams and tracks campaign delivery. Responsible for client communication and final report packages
Location
Klaipėda
Device
keep all campaigns on track and deliver documentation on time without manual data collection
Motivation
keep all campaigns on track and deliver documentation on time without manual data collection
Pain
campaign status has to be gathered manually from multiple sources, deadlines easy to miss
UX Flow
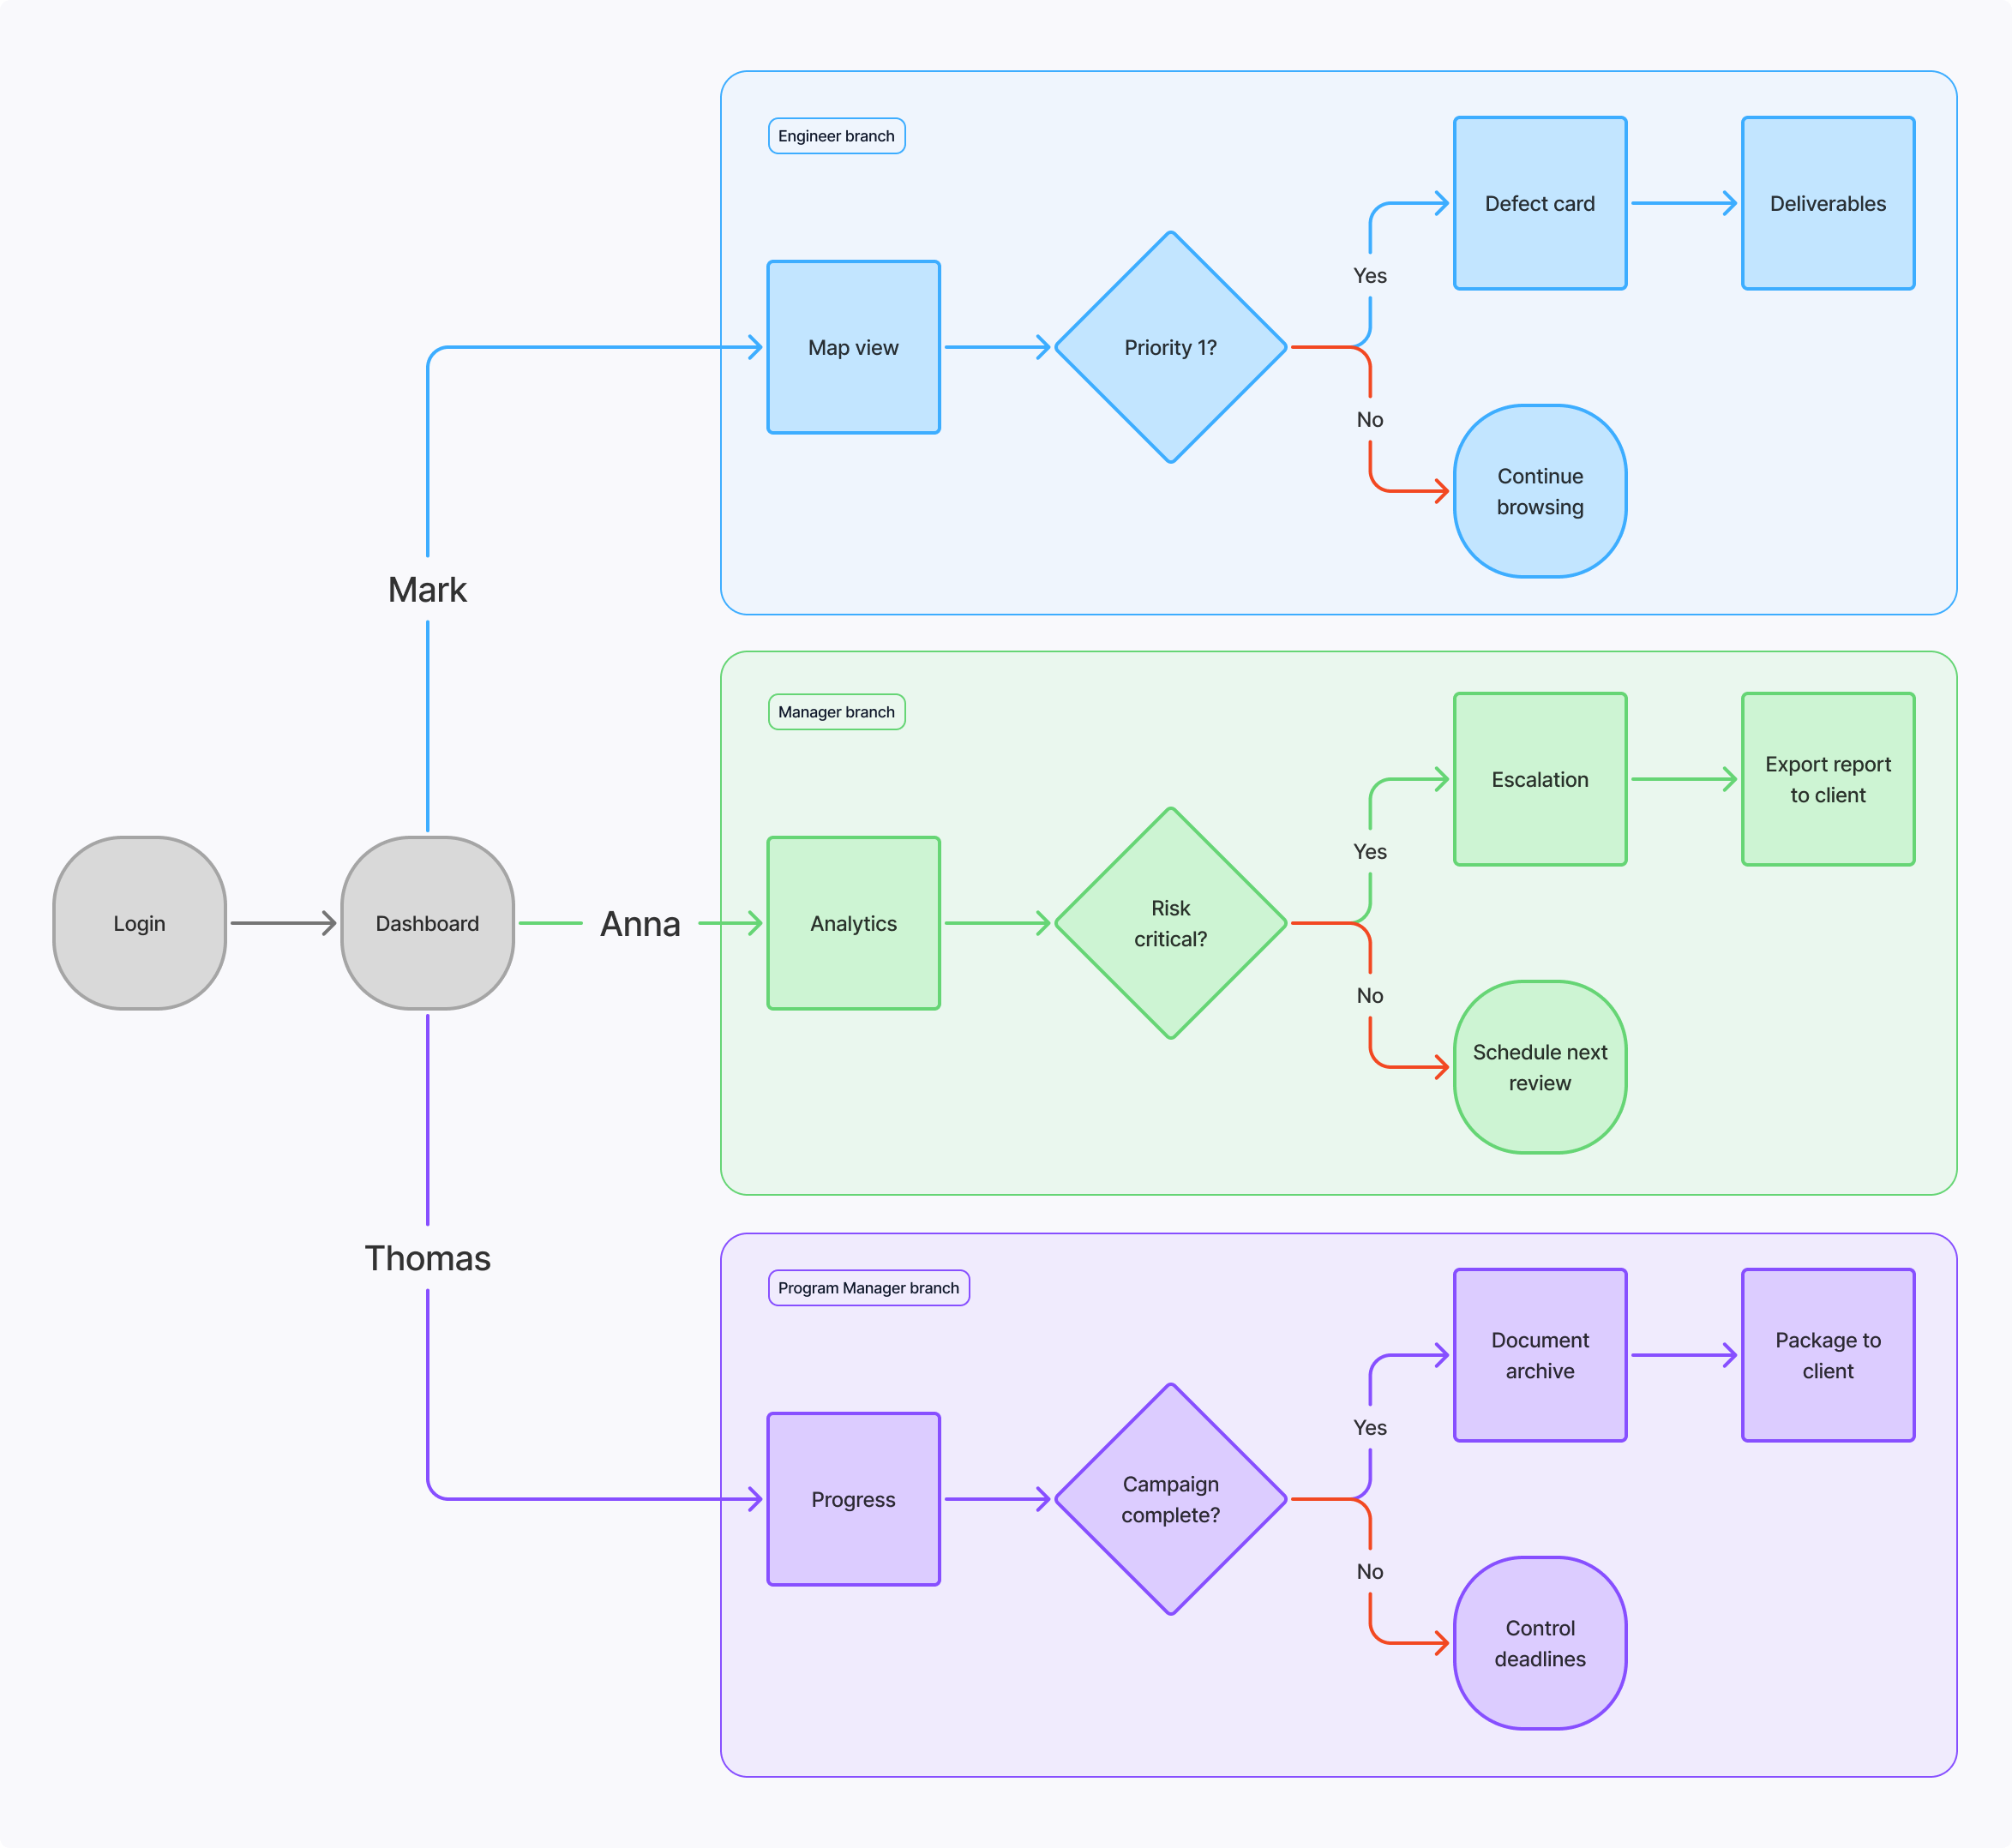
Before designing the interfaces, a user flow was mapped for all three roles — engineer, manager, and inspection programs lead. This defined the key scenarios and decision points within each platform module
Flow diagram
Key Screens
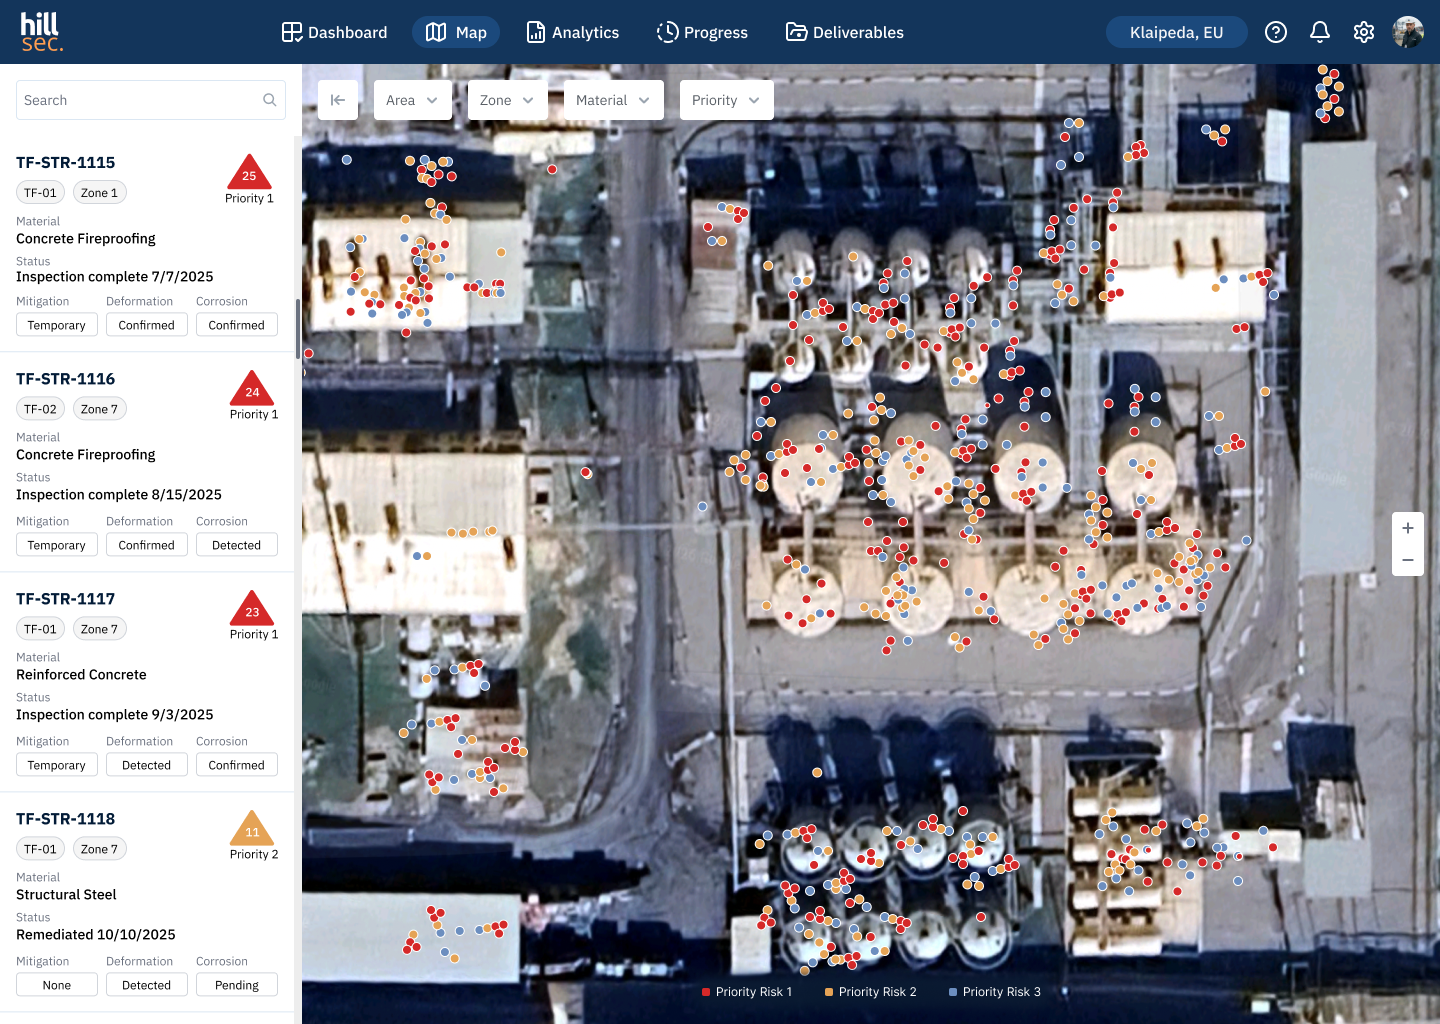
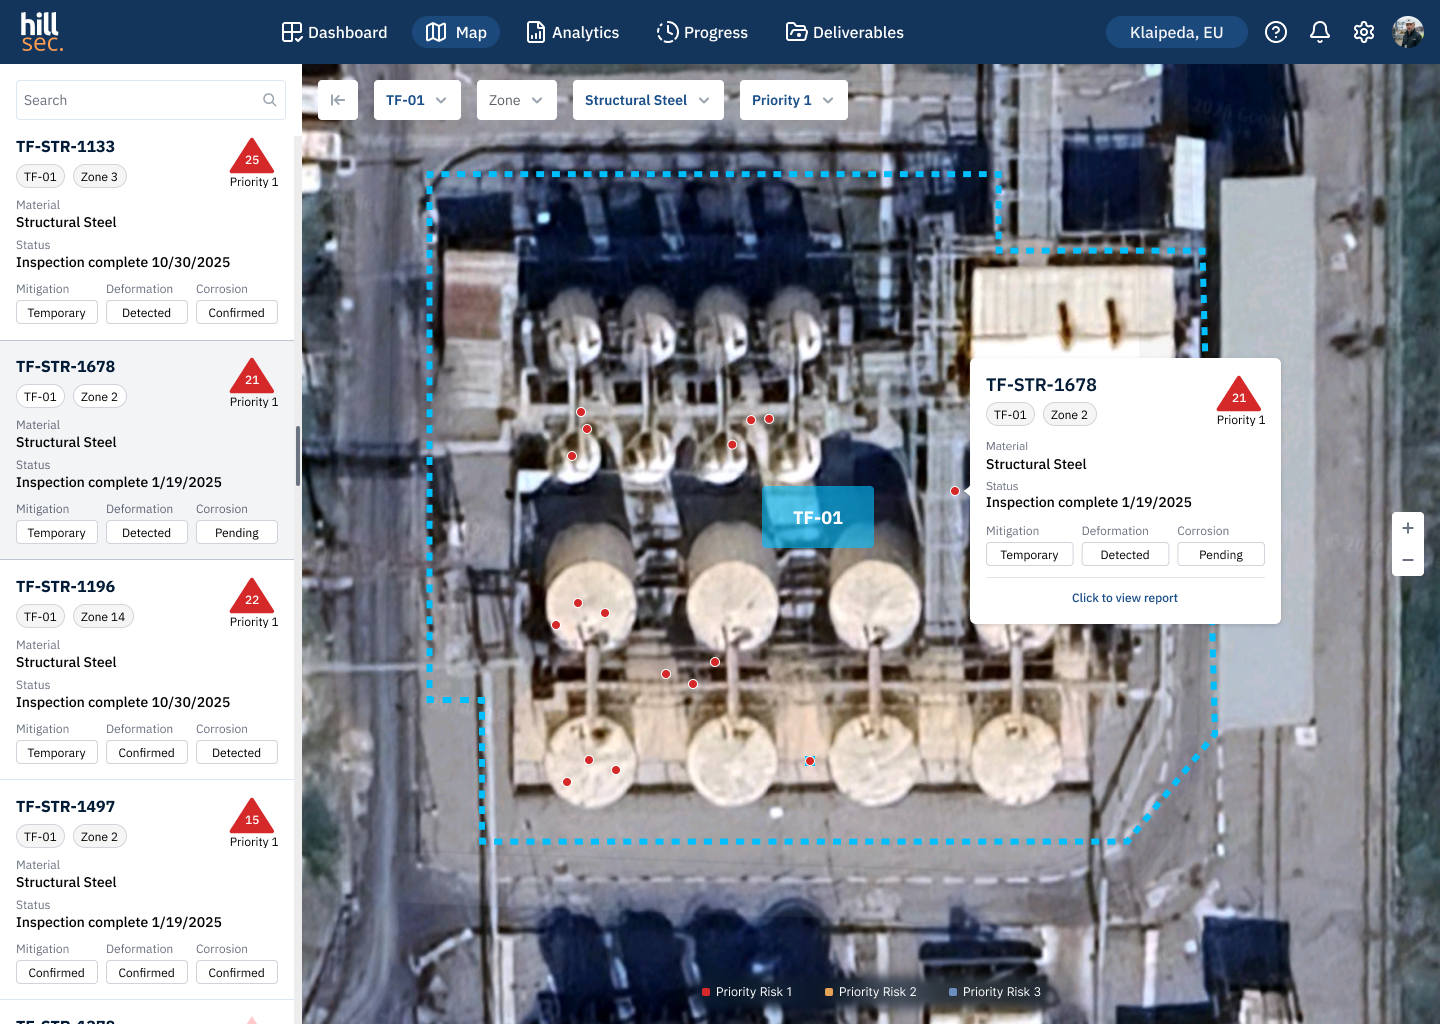
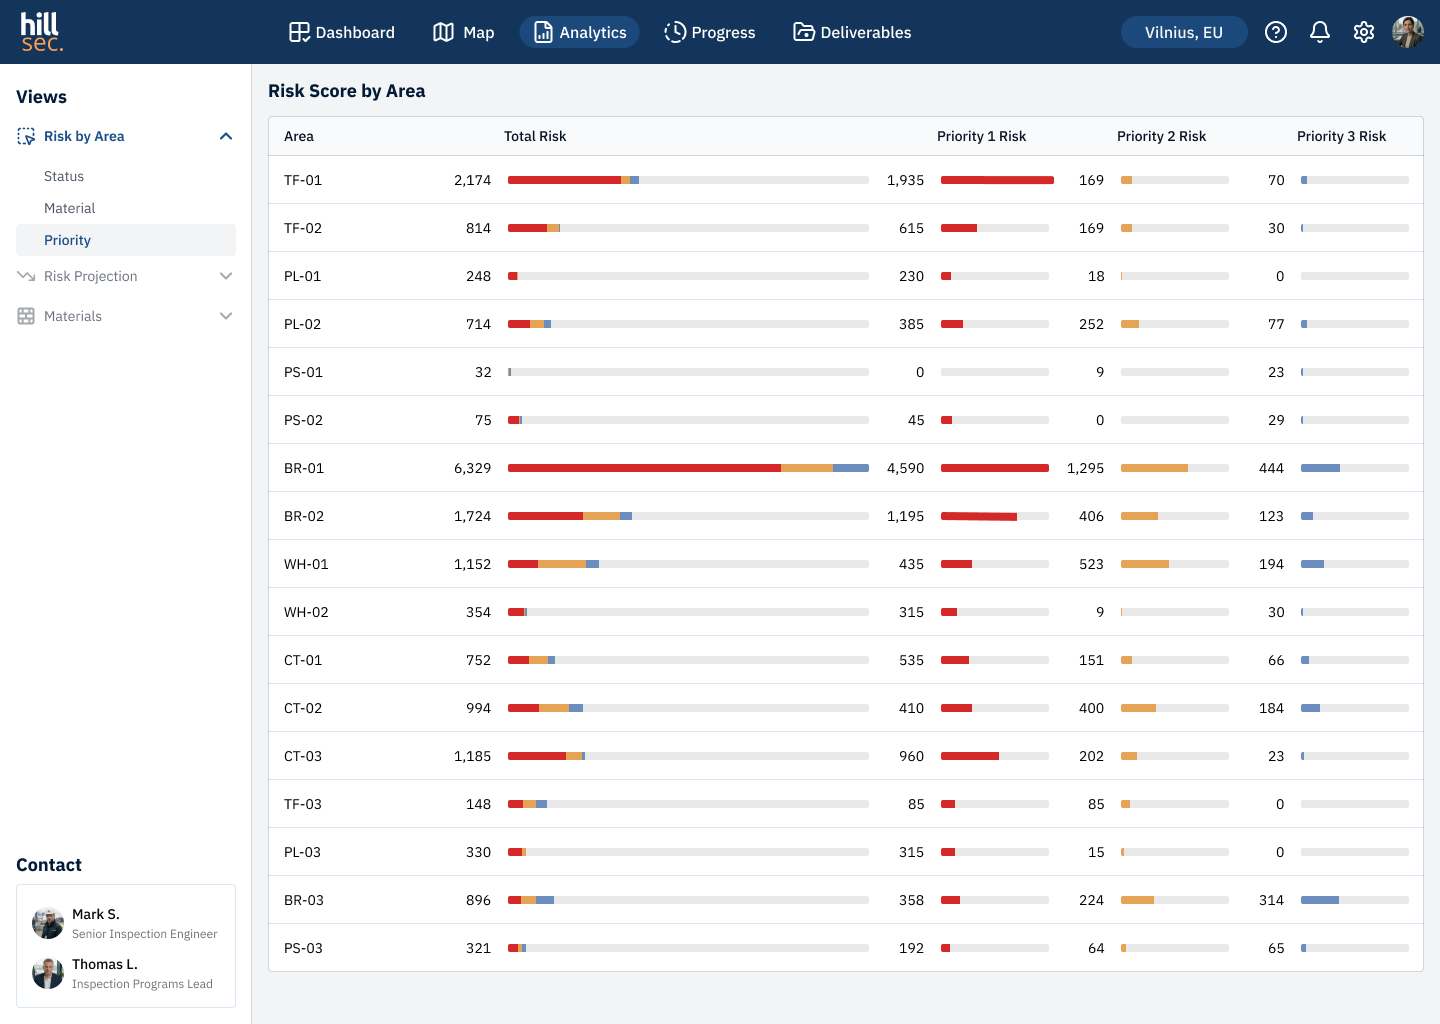
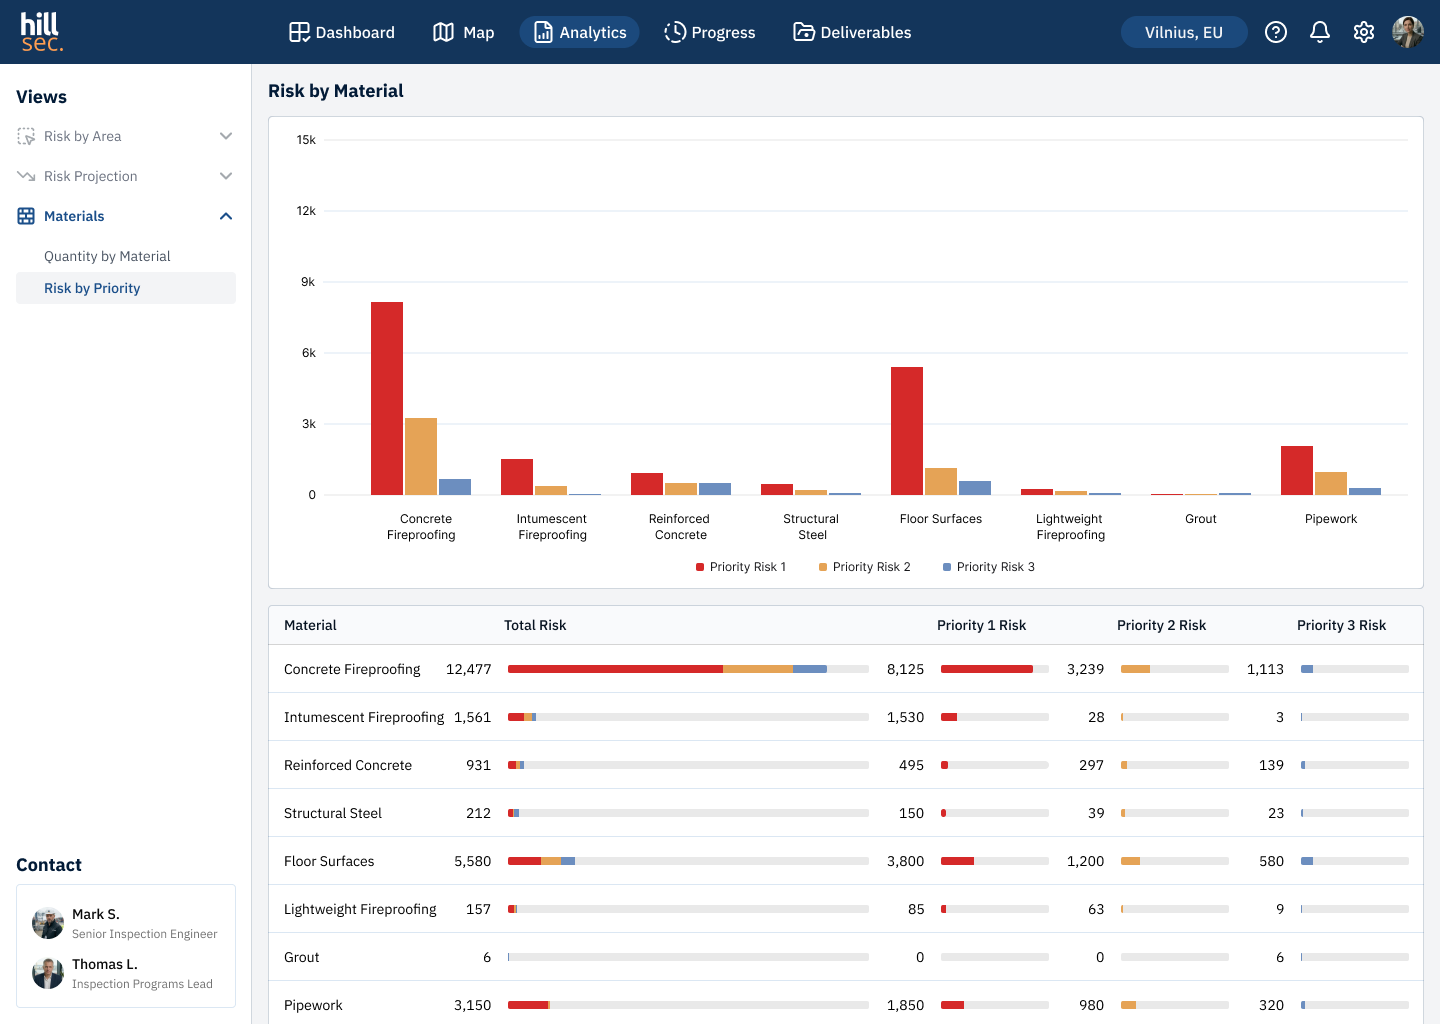
Interfaces were designed for three user scenarios: the engineer works with the findings map and defect cards, the manager analyses risks and escalates decisions, the programs lead tracks campaign progress and prepares documentation packages
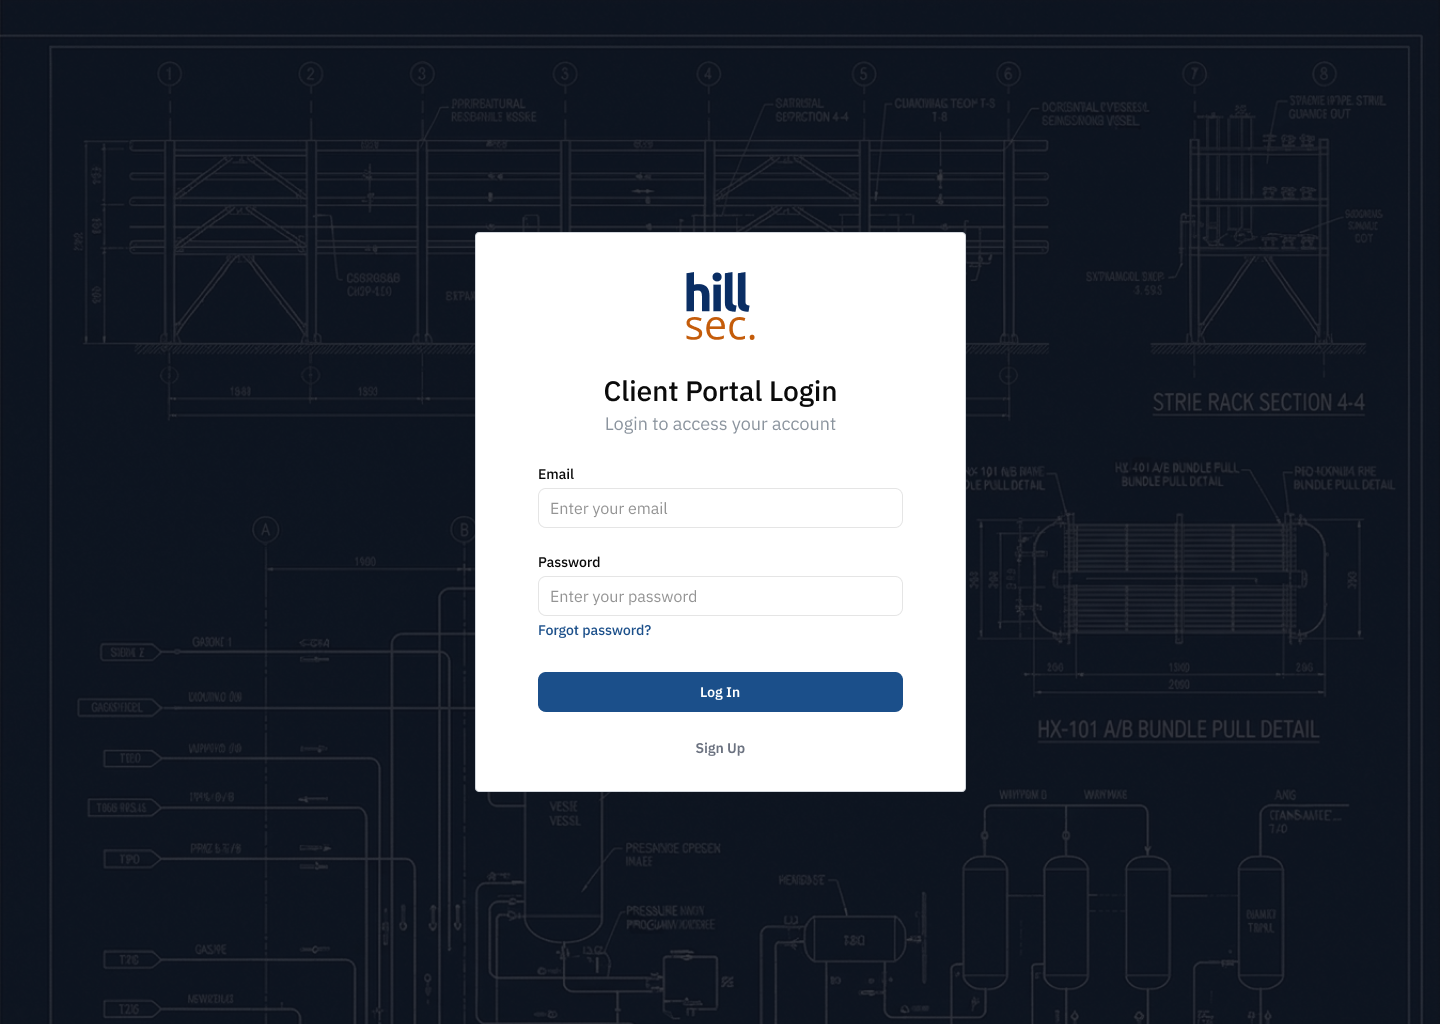
Authorization
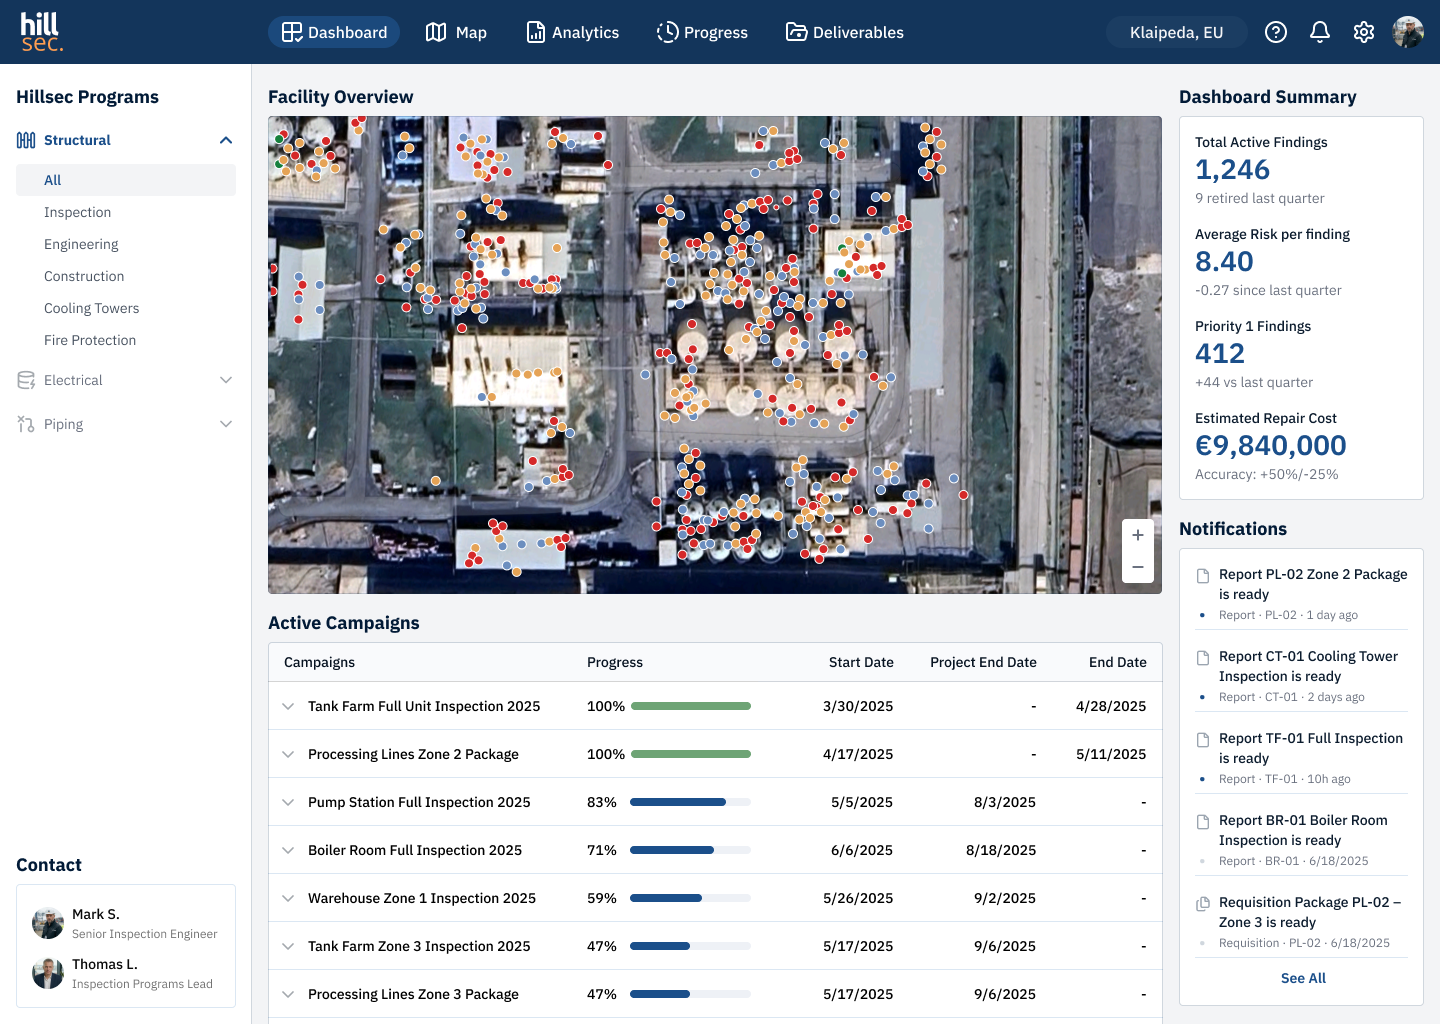
Dashboard
Site Map
Map — Area Filter
Analytics — Risk by Area
Analytics — Risk by Material
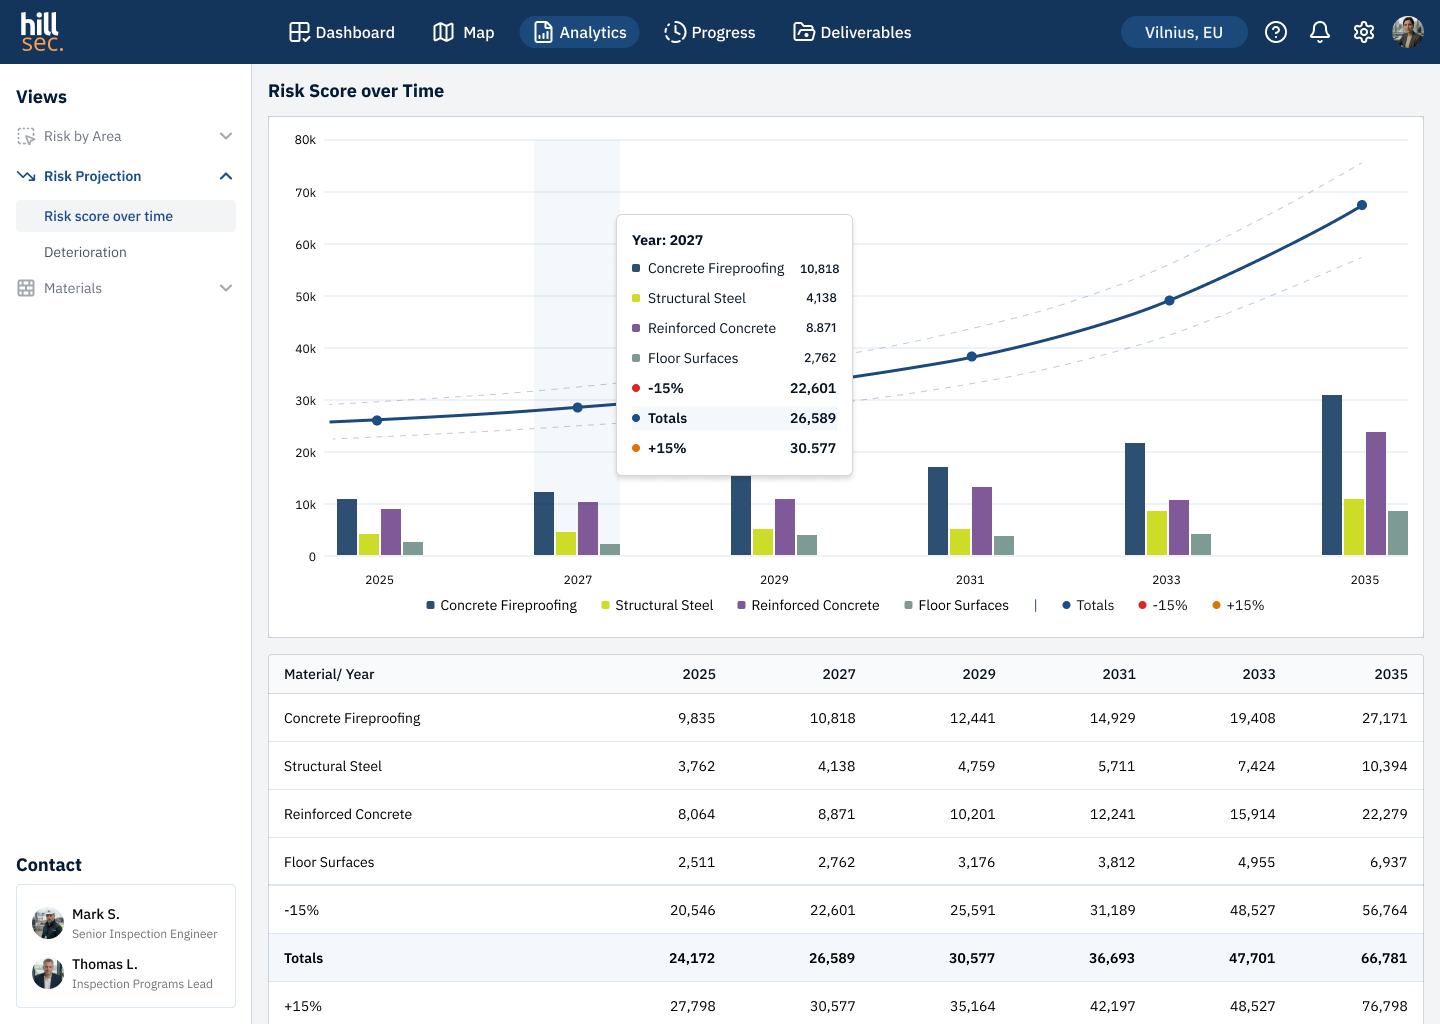
Analytics — Risk Projection
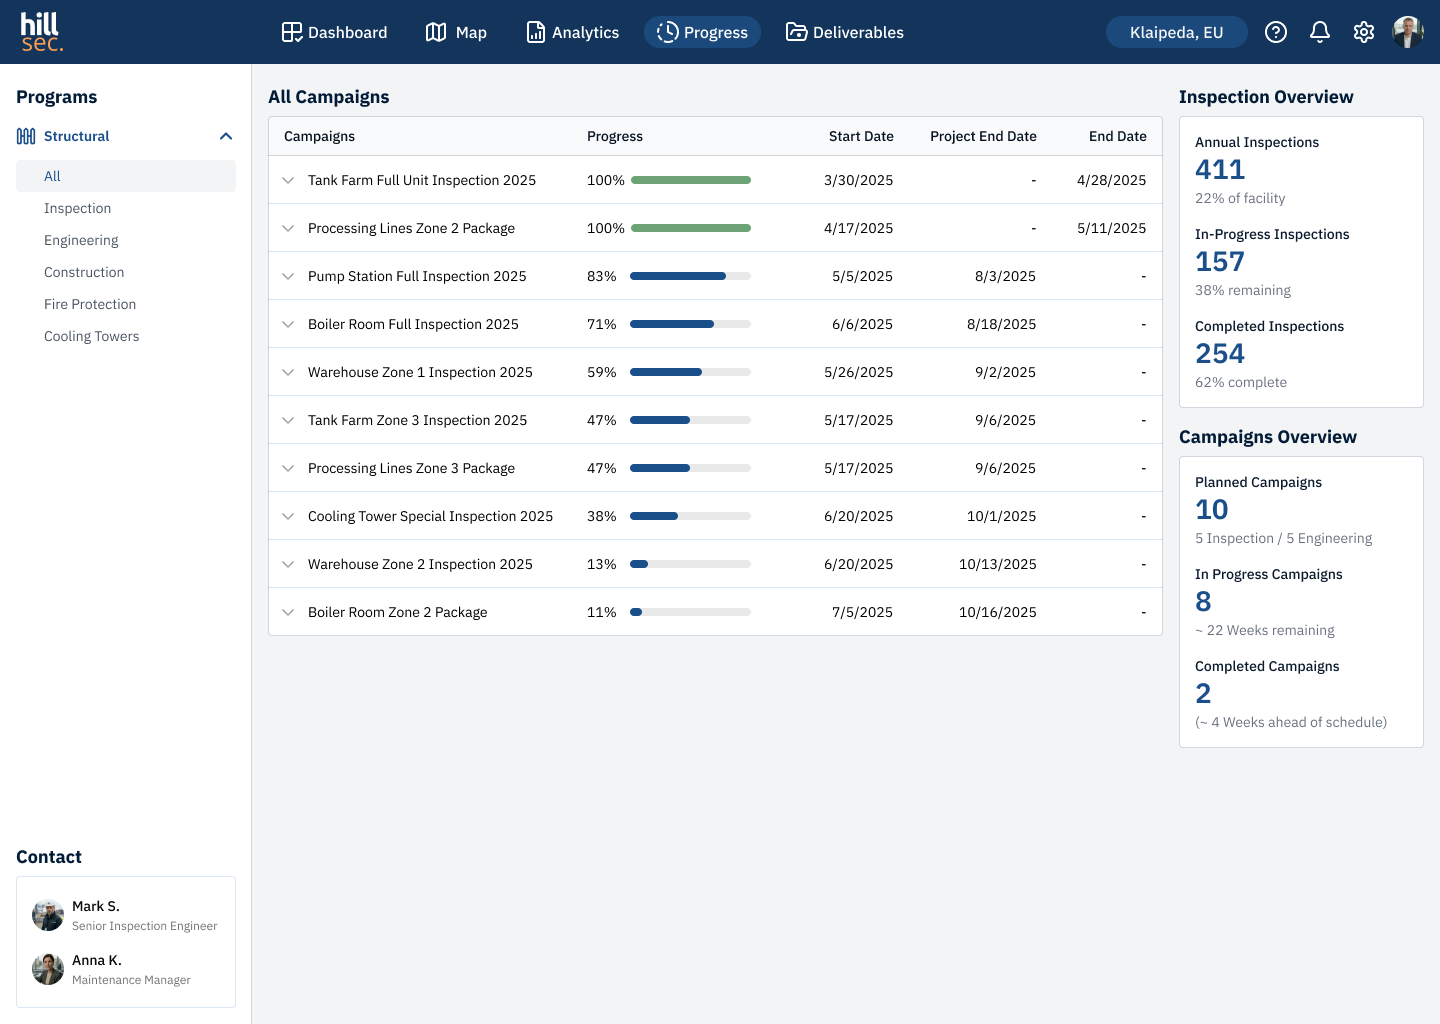
Campaign Progress
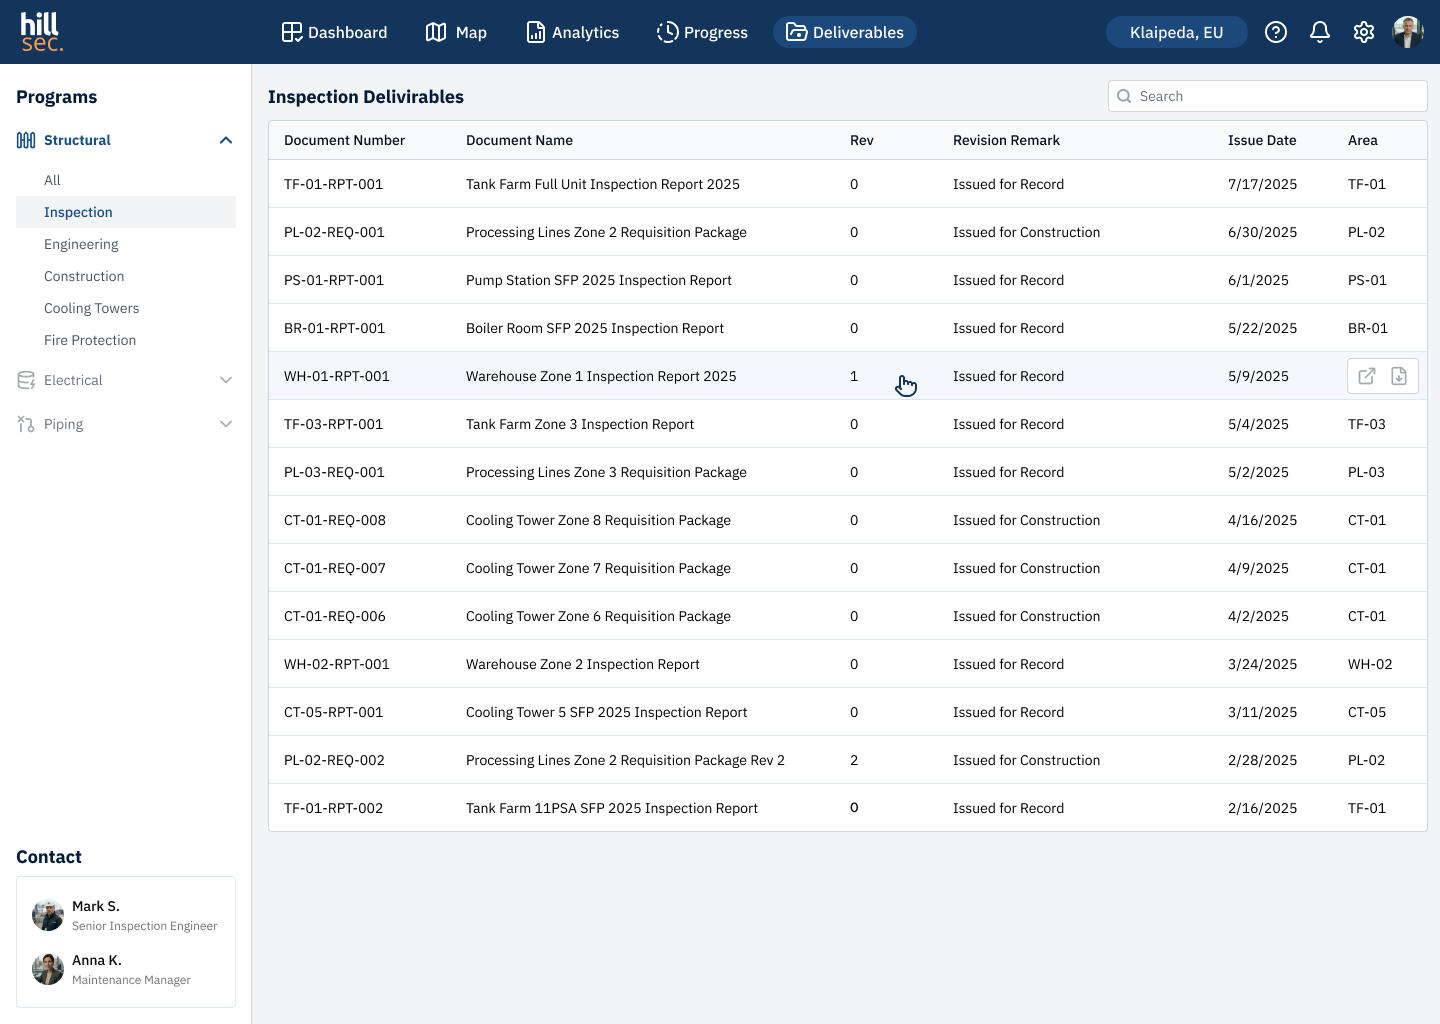
Inspection Deliverables
Conclusion
Ostral was my first experience designing a data-heavy B2B product. Over one month, working closely with a project manager, we completed the full cycle — from requirements gathering and UX logic to final UI. Three different users required three different approaches to information delivery — a findings map for the engineer, risk analytics for the manager, campaign progress for the programs lead
Designing data-heavy interfaces taught me to build strict visual hierarchy — removing everything that doesn't help the user make a decision. Tight deadlines and precise client requirements taught me to balance the ideal solution against real constraints. Immersing in an industrial context made one thing clear — without understanding the domain, sound design decisions are impossible
See also
CRYPTO EXCHANGE
E-COMMERCE PLATFORM
Mobile application
Design system

Brand identity & logo
Ostral
Web Platform — UX/UI, Data Visualization, Prototyping
Ostral
OVERVIEW
Ostral is a web platform for managing inspection programs and risk monitoring across industrial facilities in the oil refining sector. Built for Hillsec — an engineering company specialising in technical maintenance of petrochemical and fat-processing plants
The core challenge was data density. Thousands of geolocated findings, multi-level risk analytics, complex filterable tables. The design goal was not just to display data — but to help users navigate it fast
ROLE
UX/UI Designer
RESPONSIBILITIES
UX/UI design, data visualisation, prototyping
TEAM
UX/UI designer, project manager
TIMELINE
2 month
Problem Statement
Hillsec's engineering team operated across disconnected tools — findings logged in spreadsheets, site maps in separate systems, reports sent by email. With thousands of geolocated defects and multi-level risk analytics, this made fast decision-making impossible
The goal was to design an advanced MVP — comprehensive enough to demonstrate real product value to the client. The deliverable was a fully interactive prototype covering all key screens and user interactions
Users
The platform serves three distinct roles — from a field engineer to an executive making budget decisions. Understanding their goals and working context shaped the navigation structure and data prioritisation
Persona #1
Mark, 42
Senior Inspection Engineer
Spends most of his time on site. Works under high data density — speed of navigation and clear visual hierarchy are critical
Location
Klaipėda
Device
tablet on site, desktop in office
Motivation
quickly locate critical findings and act without switching between tools
Pain
data scattered across systems, no unified view of the facility
Persona #2
Anna, 38
Maintenance Manager
Makes decisions on repair budgets and priorities. Doesn't dig into individual findings — needs the overall picture and risk dynamics
Location
Vilnius
Device
desktop, smartphone on site visits
Motivation
understand facility status and justify repair budgets without calling engineers
Pain
inspection updates only arrive by email, always delayed
Persona #3
Thomas, 47
Inspection Programs Lead
Coordinates engineering teams and tracks campaign delivery. Responsible for client communication and final report packages
Location
Klaipėda
Device
keep all campaigns on track and deliver documentation on time without manual data collection
Motivation
keep all campaigns on track and deliver documentation on time without manual data collection
Pain
campaign status has to be gathered manually from multiple sources, deadlines easy to miss
UX Flow
Before designing the interfaces, a user flow was mapped for all three roles — engineer, manager, and inspection programs lead. This defined the key scenarios and decision points within each platform module
Flow diagram
Key Screens
Interfaces were designed for three user scenarios: the engineer works with the findings map and defect cards, the manager analyses risks and escalates decisions, the programs lead tracks campaign progress and prepares documentation packages
Authorization
Dashboard
Site Map
Map — Area Filter
Analytics — Risk by Area
Analytics — Risk by Material
Analytics — Risk Projection
Campaign Progress
Inspection Deliverables
Conclusion
Ostral was my first experience designing a data-heavy B2B product. Over one month, working closely with a project manager, we completed the full cycle — from requirements gathering and UX logic to final UI. Three different users required three different approaches to information delivery — a findings map for the engineer, risk analytics for the manager, campaign progress for the programs lead
Designing data-heavy interfaces taught me to build strict visual hierarchy — removing everything that doesn't help the user make a decision. Tight deadlines and precise client requirements taught me to balance the ideal solution against real constraints. Immersing in an industrial context made one thing clear — without understanding the domain, sound design decisions are impossible
See also
CRYPTO EXCHANGE
E-COMMERCE PLATFORM
Mobile application
Design system
Brand identity & logo

Ostral
Web Platform — UX/UI, Data Visualization, Prototyping
Ostral
OVERVIEW
Ostral is a web platform for managing inspection programs and risk monitoring across industrial facilities in the oil refining sector. Built for Hillsec — an engineering company specialising in technical maintenance of petrochemical and fat-processing plants
The core challenge was data density. Thousands of geolocated findings, multi-level risk analytics, complex filterable tables. The design goal was not just to display data — but to help users navigate it fast
ROLE
UX/UI Designer
RESPONSIBILITIES
UX/UI design, data visualisation, prototyping
TEAM
UX/UI designer, project manager
TIMELINE
2 month
Problem Statement
Hillsec's engineering team operated across disconnected tools — findings logged in spreadsheets, site maps in separate systems, reports sent by email. With thousands of geolocated defects and multi-level risk analytics, this made fast decision-making impossible
The goal was to design an advanced MVP — comprehensive enough to demonstrate real product value to the client. The deliverable was a fully interactive prototype covering all key screens and user interactions
Users
The platform serves three distinct roles — from a field engineer to an executive making budget decisions. Understanding their goals and working context shaped the navigation structure and data prioritisation
Persona #1
Mark, 42
Senior Inspection Engineer
Spends most of his time on site. Works under high data density — speed of navigation and clear visual hierarchy are critical
Location
Klaipėda
Device
tablet on site, desktop in office
Motivation
quickly locate critical findings and act without switching between tools
Pain
data scattered across systems, no unified view of the facility
Persona #2
Anna, 38
Maintenance Manager
Makes decisions on repair budgets and priorities. Doesn't dig into individual findings — needs the overall picture and risk dynamics
Location
Vilnius
Device
desktop, smartphone on site visits
Motivation
understand facility status and justify repair budgets without calling engineers
Pain
inspection updates only arrive by email, always delayed
Persona #3
Thomas, 47
Inspection Programs Lead
Coordinates engineering teams and tracks campaign delivery. Responsible for client communication and final report packages
Location
Klaipėda
Device
desktop in office, smartphone on visits
Motivation
keep all campaigns on track and deliver documentation on time without manual data collection
Pain
campaign status has to be gathered manually from multiple sources, deadlines easy to miss
UX Flow
Before designing the interfaces, a user flow was mapped for all three roles — engineer, manager, and inspection programs lead. This defined the key scenarios and decision points within each platform module
Flow diagram
Key Screens
Interfaces were designed for three user scenarios: the engineer works with the findings map and defect cards, the manager analyses risks and escalates decisions, the programs lead tracks campaign progress and prepares documentation packages
Authorization
Dashboard
Site Map
Map — Area Filter
Analytics — Risk by Area
Analytics — Risk by Material
Analytics — Risk Projection
Campaign Progress
Inspection Deliverables
Conclusion
Ostral was my first experience designing a data-heavy B2B product. Over one month, working closely with a project manager, we completed the full cycle — from requirements gathering and UX logic to final UI. Three different users required three different approaches to information delivery — a findings map for the engineer, risk analytics for the manager, campaign progress for the programs lead
Designing data-heavy interfaces taught me to build strict visual hierarchy — removing everything that doesn't help the user make a decision. Tight deadlines and precise client requirements taught me to balance the ideal solution against real constraints. Immersing in an industrial context made one thing clear — without understanding the domain, sound design decisions are impossible
See also
CRYPTO EXCHANGE
E-COMMERCE PLATFORM
Mobile application
Design system
Brand identity & logo